In my last post, I described how I set up my home NAS. The entry was getting kind of long, so I left alerting for this blog entry. I thought I’d go full cloud native here by using Prometheus,
I also installed pushgateway, node exporter, and alertmanager. Node-exporter came with text file collector scripts which I used instead of pushgateway.
The Ubuntu packaging actually came with a lot more than I expected. It included btrfs_stats.py to monitor btrfs volumes. Node-exporter also monitors HDD free space and SMART stats. The btrfs_stats.py wasn’t enabled by default, so I created:
cat << EOF > /etc/systemd/system/prometheus-node-exporter-btrfs.service
[Unit]
Description=Collect btrfs metrics for prometheus-node-exporter

[Service]
Type=oneshot
Environment=TMPDIR=/var/lib/prometheus/node-exporter
ExecStart=/bin/bash -c "/usr/share/prometheus-node-exporter-collectors/btrfs_stats.py | sponge /var/lib/prometheus/node-exporter/brtfs_stats.prom"
EOF

cat << EOF > /etc/systemd/system/prometheus-node-exporter-btrfs.timer
[Unit]
Description=Run btrfs metrics collection every 15 minutes

[Timer]
OnBootSec=0
OnUnitActiveSec=15min

[Install]
WantedBy=timers.target
EOF

systemctl daemon-reload
systemctl start prometheus-node-exporter-btrfs.timer
This raw stats look like this:
# TYPE node_btrfs_errors_total counter
# HELP node_btrfs_errors_total number of btrfs errors
node_btrfs_errors_total{mountpoint="/mnt/backup",device="/dev/sdb",type="write_io_errs"} 0
node_btrfs_errors_total{mountpoint="/mnt/backup",device="/dev/sdb",type="read_io_errs"} 0
node_btrfs_errors_total{mountpoint="/mnt/backup",device="/dev/sdb",type="flush_io_errs"} 0
node_btrfs_errors_total{mountpoint="/mnt/backup",device="/dev/sdb",type="corruption_errs"} 0
node_btrfs_errors_total{mountpoint="/mnt/backup",device="/dev/sdb",type="generation_errs"} 0
node_btrfs_errors_total{mountpoint="/mnt/backup",device="/dev/sdd",type="write_io_errs"} 0
node_btrfs_errors_total{mountpoint="/mnt/backup",device="/dev/sdd",type="read_io_errs"} 0
node_btrfs_errors_total{mountpoint="/mnt/backup",device="/dev/sdd",type="flush_io_errs"} 0
node_btrfs_errors_total{mountpoint="/mnt/backup",device="/dev/sdd",type="corruption_errs"} 0
node_btrfs_errors_total{mountpoint="/mnt/backup",device="/dev/sdd",type="generation_errs"} 0
# TYPE node_btrfs_allocation_size_bytes gauge
# HELP node_btrfs_allocation_size_bytes btrfs allocation data (total_bytes)
# TYPE node_btrfs_allocation_used_bytes gauge
# HELP node_btrfs_allocation_used_bytes btrfs allocation data (bytes_used)
# TYPE node_btrfs_allocation_reserved_bytes gauge
# HELP node_btrfs_allocation_reserved_bytes btrfs allocation data (bytes_reserved)
# TYPE node_btrfs_allocation_pinned_bytes gauge
# HELP node_btrfs_allocation_pinned_bytes btrfs allocation data (bytes_pinned)
# TYPE node_btrfs_allocation_disk_size_bytes gauge
# HELP node_btrfs_allocation_disk_size_bytes btrfs allocation data (disk_total)
# TYPE node_btrfs_allocation_disk_used_bytes gauge
# HELP node_btrfs_allocation_disk_used_bytes btrfs allocation data (disk_used)
node_btrfs_allocation_size_bytes{fs="69d03e6e-55c3-4c52-8602-1100b9db0feb",type="data"} 1371168309248
node_btrfs_allocation_used_bytes{fs="69d03e6e-55c3-4c52-8602-1100b9db0feb",type="data"} 1058184822784
node_btrfs_allocation_reserved_bytes{fs="69d03e6e-55c3-4c52-8602-1100b9db0feb",type="data"} 0
node_btrfs_allocation_pinned_bytes{fs="69d03e6e-55c3-4c52-8602-1100b9db0feb",type="data"} 0
node_btrfs_allocation_disk_size_bytes{fs="69d03e6e-55c3-4c52-8602-1100b9db0feb",type="data"} 2742336618496
node_btrfs_allocation_disk_used_bytes{fs="69d03e6e-55c3-4c52-8602-1100b9db0feb",type="data"} 2116369645568
node_btrfs_allocation_size_bytes{fs="69d03e6e-55c3-4c52-8602-1100b9db0feb",type="metadata"} 4294967296
node_btrfs_allocation_used_bytes{fs="69d03e6e-55c3-4c52-8602-1100b9db0feb",type="metadata"} 2380333056
node_btrfs_allocation_reserved_bytes{fs="69d03e6e-55c3-4c52-8602-1100b9db0feb",type="metadata"} 0
node_btrfs_allocation_pinned_bytes{fs="69d03e6e-55c3-4c52-8602-1100b9db0feb",type="metadata"} 0
node_btrfs_allocation_disk_size_bytes{fs="69d03e6e-55c3-4c52-8602-1100b9db0feb",type="metadata"} 8589934592
node_btrfs_allocation_disk_used_bytes{fs="69d03e6e-55c3-4c52-8602-1100b9db0feb",type="metadata"} 4760666112
node_btrfs_allocation_size_bytes{fs="69d03e6e-55c3-4c52-8602-1100b9db0feb",type="system"} 8388608
node_btrfs_allocation_used_bytes{fs="69d03e6e-55c3-4c52-8602-1100b9db0feb",type="system"} 229376
node_btrfs_allocation_reserved_bytes{fs="69d03e6e-55c3-4c52-8602-1100b9db0feb",type="system"} 0
node_btrfs_allocation_pinned_bytes{fs="69d03e6e-55c3-4c52-8602-1100b9db0feb",type="system"} 0
node_btrfs_allocation_disk_size_bytes{fs="69d03e6e-55c3-4c52-8602-1100b9db0feb",type="system"} 16777216
node_btrfs_allocation_disk_used_bytes{fs="69d03e6e-55c3-4c52-8602-1100b9db0feb",type="system"} 458752
Next I wanted to set an alert when node_btrfs_errors_total > 0. It’s
possible to test these queries in the Prometheus web portal (default
port).
First, edit your top level prometheus yaml to include a rule file and point to alertmanager:
rule_files:
  - "prometheus-alerts.yaml"

# Alertmanager configuration
alerting:
  alertmanagers:
  - static_configs:
    - targets: ['localhost:9093']
Then edit prometheus-alerts.yaml to create the alert:
{% raw %}
groups:
- name: example
rules:
# Alert for any instance that is unreachable for >5 minutes.
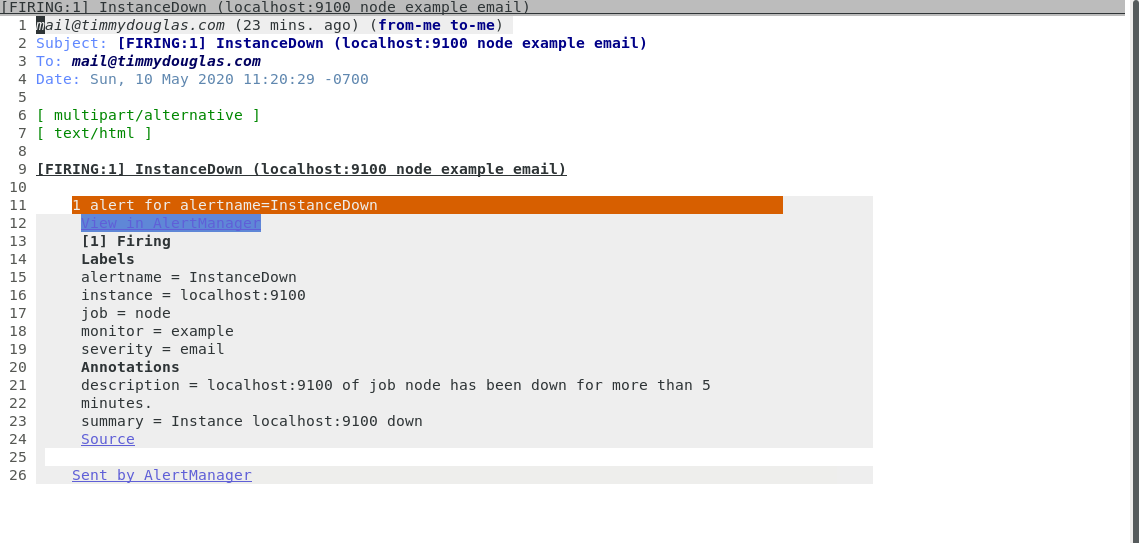
- alert: InstanceDown
expr: up == 0
for: 5m
labels:
severity: email
annotations:
summary: "Instance {{ $labels.instance }} down"
description: "{{ $labels.instance }} of job {{ $labels.job }} has been down for more than 5 minutes."
- alert: BtrfsErrors
expr: node_btrfs_errors_total > 0
for: 10m
labels:
severity: email
annotations:
summary: "Instance {{ $labels.instance }} has btrfs errors"
description: "{{ $labels.instance }} has btrfs errors..."
{% endraw %}
You’ll also need to edit /etc/prometheus/alertmanager.yml to set up
how the alert is sent. You’ll want to fix the password
options. You might want to edit /etc/default/prometheus-alertmanager
or similar to set the log level to debug if you have issues sending
the email.
global:
  smtp_smarthost: 'localhost:587'
  smtp_from: 'your@email'
  smtp_auth_username: 'username'
  smtp_auth_password: 'secret'


# The directory from which notification templates are read.
templates:
- '/etc/prometheus/alertmanager_templates/*.tmpl'

# The root route on which each incoming alert enters.
route:
  group_by: ['alertname']
  group_wait: 30s
  group_interval: 5m
  repeat_interval: 3h
  receiver: timmy

receivers:
- name: 'timmy'
  email_configs:
  - to: 'your@email'
Oh, I also changed my email client to Notmuch + GNU/Emacs. Maybe I’ll talk about that in another post.